Browser Documentation
The following topics are documented on this page:
- Multiple hypothesis testing
- Enrichment with drug classes (phenotype pages)
- Enrichment with ontologies (phenotype pages)
- How to save plots
- cis-Mendelian Randomization analysis
- QQ-plot interpretation (gene pages)
Multiple hypothesis testing
In ExPheWas, a single association test is conducted for every gene-phenotype pair. In total, this corresponds to ~4.6 million tests (26,616 × 1,746) per subgroup (i.e. male-only, female-only and sex-combined).
To control for false positives due to multiple testing, we provide statistics of varying stringency including the uncorrected P-value, the Bonferroni corrected P-value and the Q-value.
When browsing results by phenotype, we assume that users are searching for genes associated with one phenotype of interest, and the multiple testing correction is based on the 26,613 considered genes. This adjustment is used for the Bonferroni correction and the Q-values are also calculated based on the 26,613 tests.
When browsing results by gene, we assume that users are searching for phenotypes associated with a gene of interest. Hence, the correction is based on the 1,746 tested phenotypes. For this reason, the reported Bonferroni corrected P-values and Q-values will be different for the same association test depending on the page on which they are found. This is expected because our multiple hypothesis testing strategy depends on the underlying research question.
Enrichment with drug classes (phenotype pages)
Anatomical Therapeutic Chemical Classification (ATC) codes define a hierarchical classification of drug classes. Drug target proteins for drugs in ATC classes were extracted from the ChEMBL database. Fisher's exact test is then used to test for enrichment based on the 2x2 contingency table of genes encoding targets of drugs in a given ATC class and genes associated with a selected phenotype in ExPheWas.
To represent the hierarchical structure of the ATC vocabulary, we visualize the enrichment results as a tree. The color of each node indicates the enrichment p-value. The color of the border represents the lowest p-value in the subtree rooted at the node. The tree is interactive, and each node can be expanded to show its children by clicking on it.
The figure below shows the results from the drug target enrichment analysis for genes associated with essential hypertension (outcome 401.1). For example, ATC class C (cardiovascular system) shows no significant gene enrichment (p-value of 0.612), but the red border shows that at least one of its children node has a significant p-values. Expanding the C node shows enrichments for ATC codes C02 (antihypertensives) and C07 (beta blocking agents) with p-values of 0.008 and 0.015, respectively. Again, the red border for ATC class C01 (cardiac therapy) shows that at least one of its subclasses is significant. Expanding the C01 branch reveals that ATC C01DA (organic nitrates) is significantly enriched with a p-value of 0.002.
Enrichment Analysis for Essential hypertension (401.1)
Enrichment with ontologies (phenotype pages)
We also integrated enrichment analysis between genes associated with a phenotype and various ontologies using g:Profiler. If enough genes are associated with the phenotypes (with q-value ≤ 0.05), the list of associated genes is automatically evaluated for enrichment with Gene Ontology term, Human Phenotype Ontology terms or KEGG pathways. The enrichment p-values are then visualized.
Enrichment results for Essential hypertension (401.1) are shown below.
How to save plots
Figures in the browser are vector-based and use the SVG format. Because they are vector-based, they can be scaled and are suitable for printed documents such as scientific posters or articles.
The easiest way to save plots displayed in ExPheWas is to use browser extensions. We suggest using either SVG Export or svg-grabber on Google Chrome, or SVG Export for Firefox. SVG Export will be documented here, because it is available for both Google Chrome and Firefox.
As an example, we will download the g:Profiler enrichment results for "Essential hypertension". First, navigate to the phenotype page, and wait for the page to load completely (including the automatically generated plots). Then, launch the SVG Export plugin as displayed below or using your brower's plugin interface.
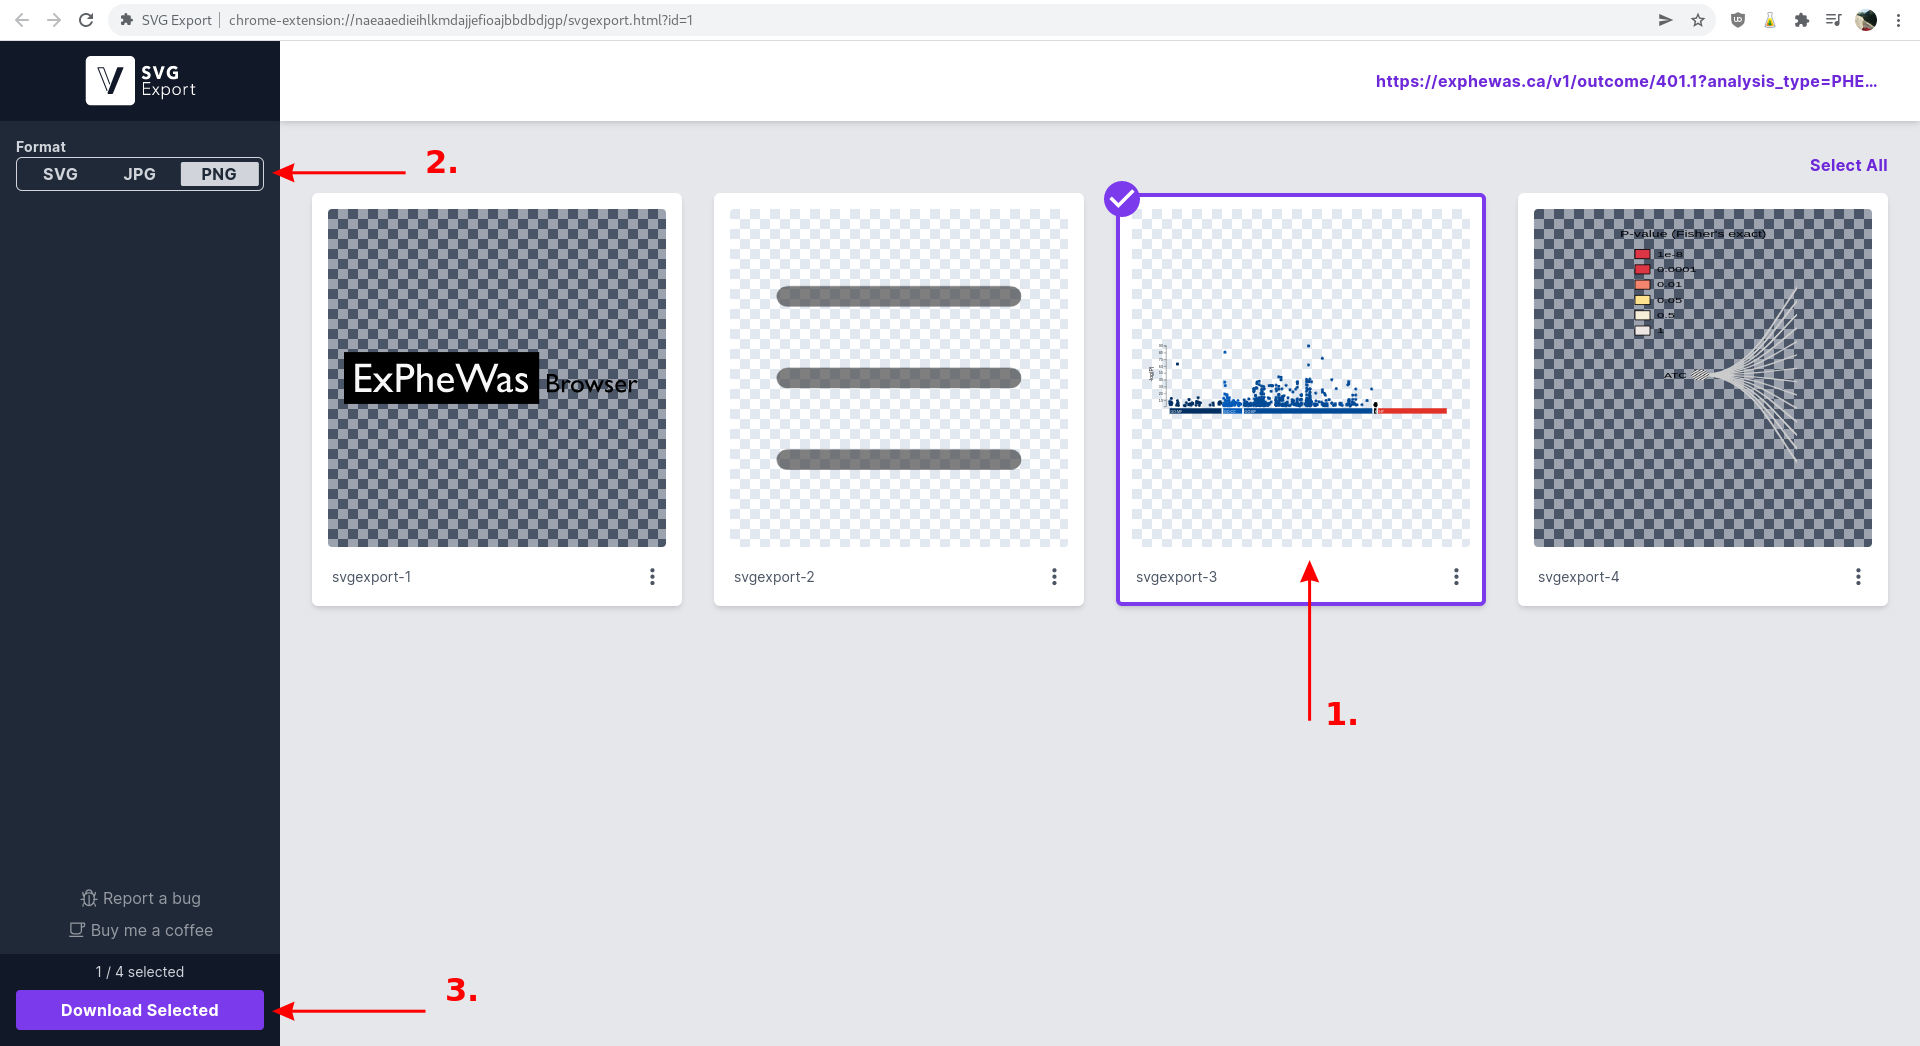
A new tab will automatically open. 1) Select the g:Profiler plot and 2) the desired format (PNG in this example). 3) click the "Download Selected" button at the bottom to download the selected image.
cis-MR analysis
Mendelian randomization (MR) is used to estimate the causal effect of an exposure on an outcome using genetic variation as an instrumental variable. In ExPheWas, we implement a version of MR where genetic variation within a single gene is of interest. This is useful in the setting of cis-MR, a framework where only genetic variants near (in cis) of the gene encoding the gene product of interest are used. This approach has been formalized by others (see Schmidt AF et al. 2020, Nature Communications), where it is emphasized that although it would be ideal to have direct measurements of the gene product enabling formal mediation analysis when considering the effect of a specific gene, it is also possible to use proxy phenotypes selected based on the known gene function in order to estimate the magnitude of the effect of genetic perturbation on the target gene. The implementation of MR in ExPheWas was designed under this paradigm.
The MR implementation used here relies on the inverse variance weighted estimator computed using gene-based principal components as instrumental variables. Hence, the conventional instrumental assumptions are needed to obtain valid causal estimates. Briefly, these assumptions are:
- Relevance: The instrumental variable is associated with the exposure.
- Unconfoundedness: There are no common causes of the genetic instrumental variable and outcome.
- Exclusion: The effect of the instrumental variable on the outcome is fully mediated by the exposure.
We provide the following specific recommendations in the context of ExPheWas MR analyses:
- Ensure that the selected gene-exposure pair has a robust and well understood relationship. For example, converging evidence from different sources (e.g. GWAS, family studies, Mendelian diseases, model organisms or studies of predicted loss-of-function variants) adds credibility to a result. The gene and exposure should also be strongly associated in ExPheWas.
- Assess the possibility of confounding due to LD or overlapping genetic features. It may help to visualize overlaping genes in the reported region, and to assess results derived from gene regions centered on neighbouring genes.
- Assess the risk of violations of the exclusion assumption through pleiotropic mechanisms. Visualizing the gene association QQ-plot (available on the gene pages in ExPheWas) is a good way to rapidly evaluate the risk for pleiotropy. Note that many associated phenotypes within the same causal path, so called "vertical pleitropy" is not problematic in MR.
Below is an example of cis-MR analys of the effect of LDL direct exposure on the Coronary astherosclerosis outcome based on genetic variants close to the PCSK9 gene. Note that the effects are in standardized units for continuous traits (i.e. expressed in units of standard deviation of the exposure and/or outcome).

The estimated MR effect displayed on the page for this example is: 2.04 (1.74, 2.39) (p=1.0 × 10⁻¹⁸)
QQ plot interpretation (gene pages)
Quantile-quantile (QQ) plots are commonly use in Genome-Wide association Studies as a measure of polygenicity or counfonding. Briefly, under the null hypothesis of no association (H0: β = 0), the test p-values are expected to follow a uniform distribution. The QQ plot shows the observed p-values as a function of the expected p-values under the null hypothesis (i.e. p-values following a uniform distribution). Upward deviation from the identity on this plot indicates that association statistics are "inflated".
In ExPheWas, QQ-plots are used on gene pages to show the association p-values with all tested phenotypes. It can be used to rapidly find phenotypes with association p-values that deviate from the expected distribution under the null. Systematic deviation from the identity may indicate pleiotropy, the association of a gene with different pathways or phenotypes.
Below is a QQ plot generated for the ADCY9 gene.